Lead Lift Management System: B2B analytics platform for multifamily advertising ROI
UX Designer · Sole designer on a team of three, with a PM and Engineer · 12-month project · Designed from scratch
Helping property managers see which advertising investments are working.
Apartment Finder's revenue depended on multifamily advertisers renewing their listings: property managers paying listing fees and referral commissions to drive lease traffic. The business needed to demonstrate that spend was producing measurable results. As the sole designer on a three-person team, I designed Lead Lift from scratch: a B2B analytics platform that gave property managers a clear view of which advertising sources were generating leads, converting to leases, and delivering value worth renewing.
Customer interviews and analytics data confirmed the core problem: managers had lead volume but not CPL. They could see activity but not efficiency. The design followed that finding directly.
An internal analytics platform that gave B2B advertisers clear visibility into lead performance and ROI.
Translated raw lead data into structured, searchable, filterable reporting, enabling property managers to evaluate advertising effectiveness, compare lead sources, and make data-informed budget decisions.
Built for property managers and multifamily advertisers evaluating ROI on listing investments.
Apartment Finder's monthly traffic volume meant substantial lead data flowing through the system continuously.
Property management companies and landlords paying listing fees and referral commissions, the platform's revenue engine.
Lead volume, prospect and lease conversion rate, cost per lease (CPL), and source attribution.
The user wasn't a renter browsing listings. It was a property manager trying to justify a six-figure advertising budget to their regional director.
The opportunity was to turn lead activity into advertising evidence.
The research shifted the product from a reporting interface to a performance decision tool. It clarified that managers needed evidence of advertising value, not just access to activity data, and identified the KPIs that mattered most: lead volume, source performance, conversion, signed leases, and cost per lease.
Property managers had activity data, but not performance evidence. Lead volume showed traffic. Cost per lease showed advertising effectiveness. Managers needed source attribution, conversion tracking, and lease-level ROI to support renewal planning and portfolio-level decisions.
I led discovery to understand how property managers and regional directors evaluated advertising performance. Customer interviews and analytics data showed that users were not simply checking campaign activity. They were preparing for internal business conversations about spend, performance, and renewal. That changed the design direction: the product needed to help users move from top-line performance into source-level ROI, then support comparisons across properties, lead sources, and time periods.
Budget decision context
What the research revealed
Source attribution, conversion tracking, CPL, and portfolio visibility. Property managers needed all four to answer the budget question. None of them were surfaced in a usable form in existing tools.
What the system needed to do
Surface lead volume, conversion quality, and cost efficiency in decision order. Make search the primary interaction. Support portfolio decisions across multiple properties. Require no training.
The design followed the advertising decision, not the data structure. This was not a reporting tool. It was a budget decision tool.
This reframing kept the product focused on investment confidence. Instead of exposing every available metric, the team could design a decision path that helped users evaluate source-level ROI and act on it.
Designed for a business user who measures everything but has time for nothing.
The platform focused on fast interpretation — making search and filtering the primary entry point, using plain-language metrics instead of internal data terms, and organizing performance data around the questions managers were already asking in renewal conversations.
Property managers and regional directors were experienced business users, but they had limited time. The product needed to support fast, confident interpretation without requiring users to understand internal database structures or manually calculate performance.
I designed the information architecture around the user's decision sequence: start broad, narrow the view, compare sources, evaluate conversion, and act. The product surfaced the metrics managers expected to use in advertising conversations: lead volume, lead source, conversion rate, lease count, cost per lease, and source attribution. I used business-language terms that matched how users talked about performance, not database-driven labels.
Business-user analytics model
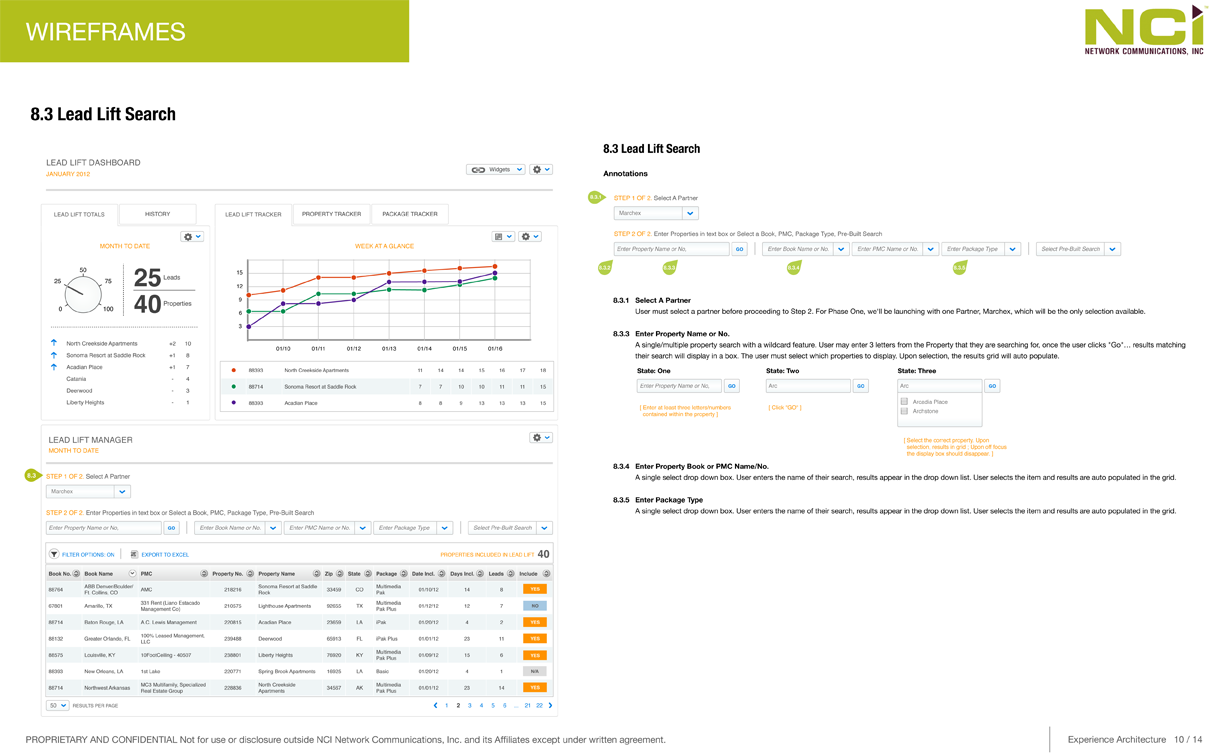
Search as primary entry point
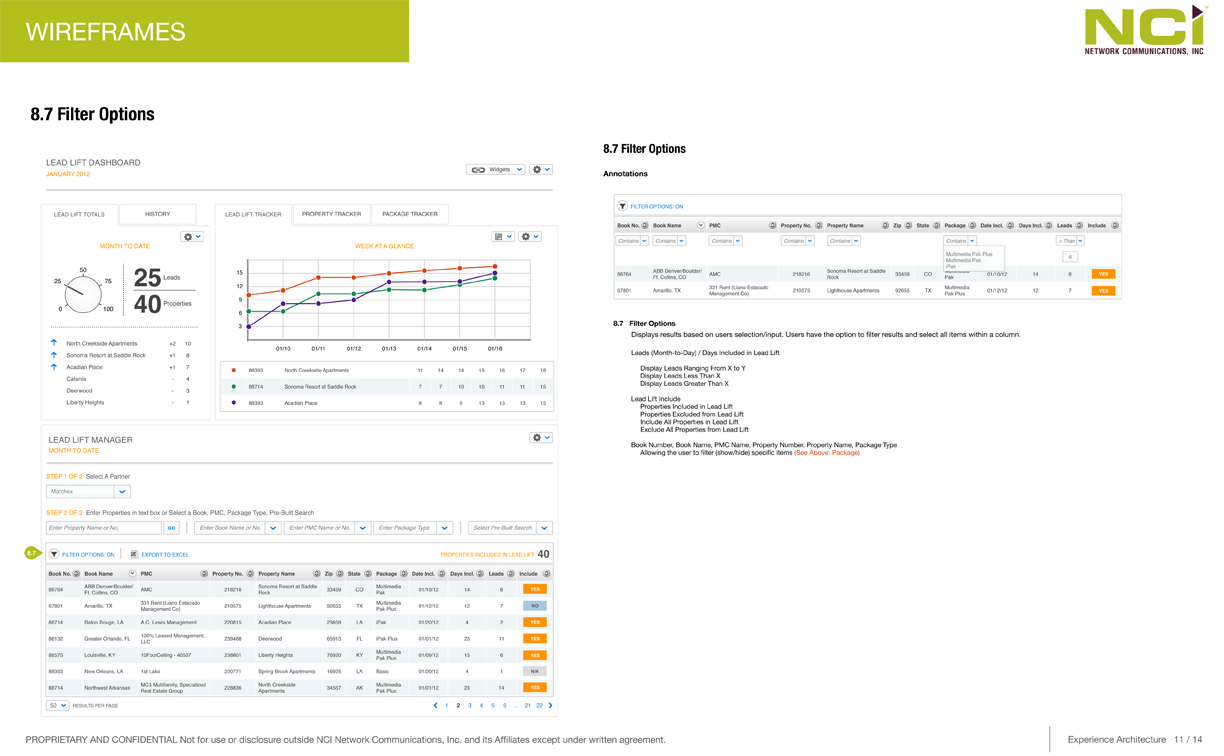
Users always knew what they were looking for. Progressive filtering narrowed the dataset before applying the next filter, reducing cognitive load on complex lead data.
Plain-language metrics
Labels used property manager vocabulary, not database field names. CPL surfaced directly, pre-calculated, not derived manually by the user.
The product became easier to use because it matched the user's operating reality. Managers needed clarity, not more data. The design helped them find the right question faster and answer it with confidence.
One decision flow, from top-line performance to source-level ROI.
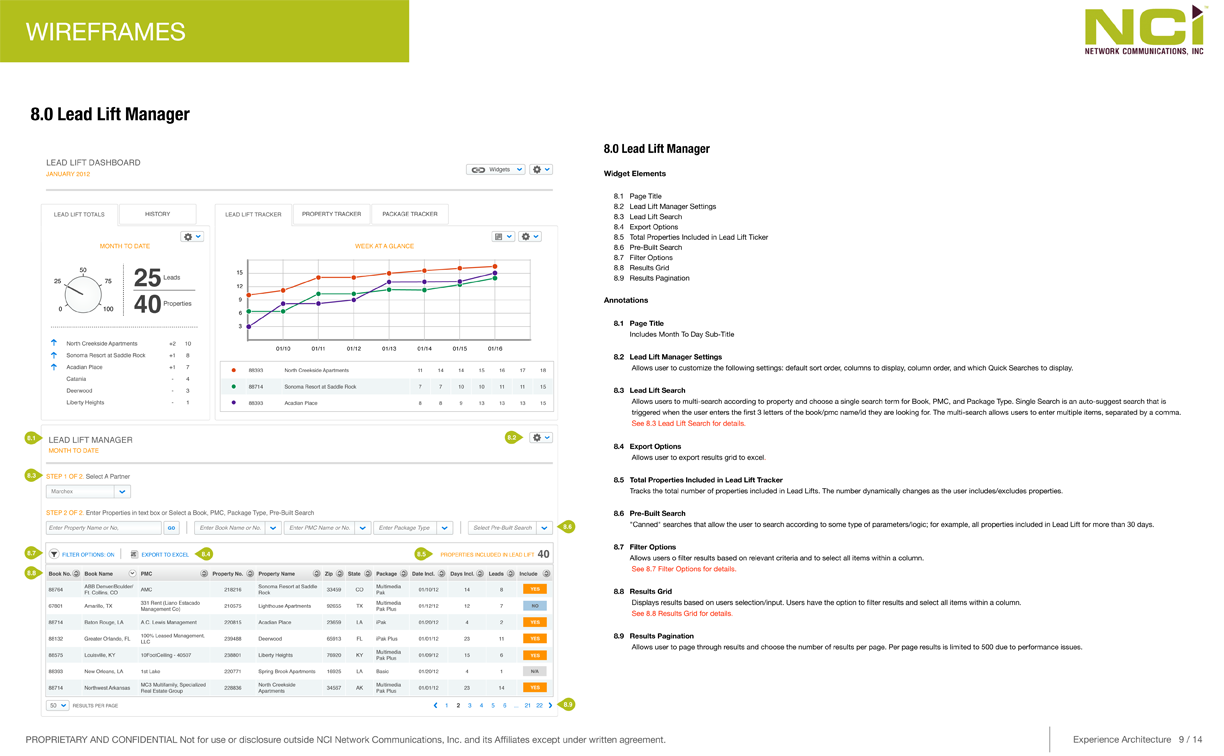
The workflow guided users from portfolio health to source-level ROI. Search and filtering were the primary way to narrow performance data. Side-by-side comparison across lead sources, properties, and markets made renewal evidence easier to find and act on.
I designed the workflow to move from summary to detail. The home dashboard surfaced overall lead performance and key trends. Search and filter controls helped managers narrow the dataset. Results grids supported comparison across sources and properties. Detail views helped users understand what was driving performance. The goal was to give users a path through the data instead of asking them to build the analysis themselves.
The workflow moved from summary to detail in the same order a manager evaluates performance: overall picture first, then drill down by source, filter by date and status, compare across properties, act on findings.
Portfolio performance overview
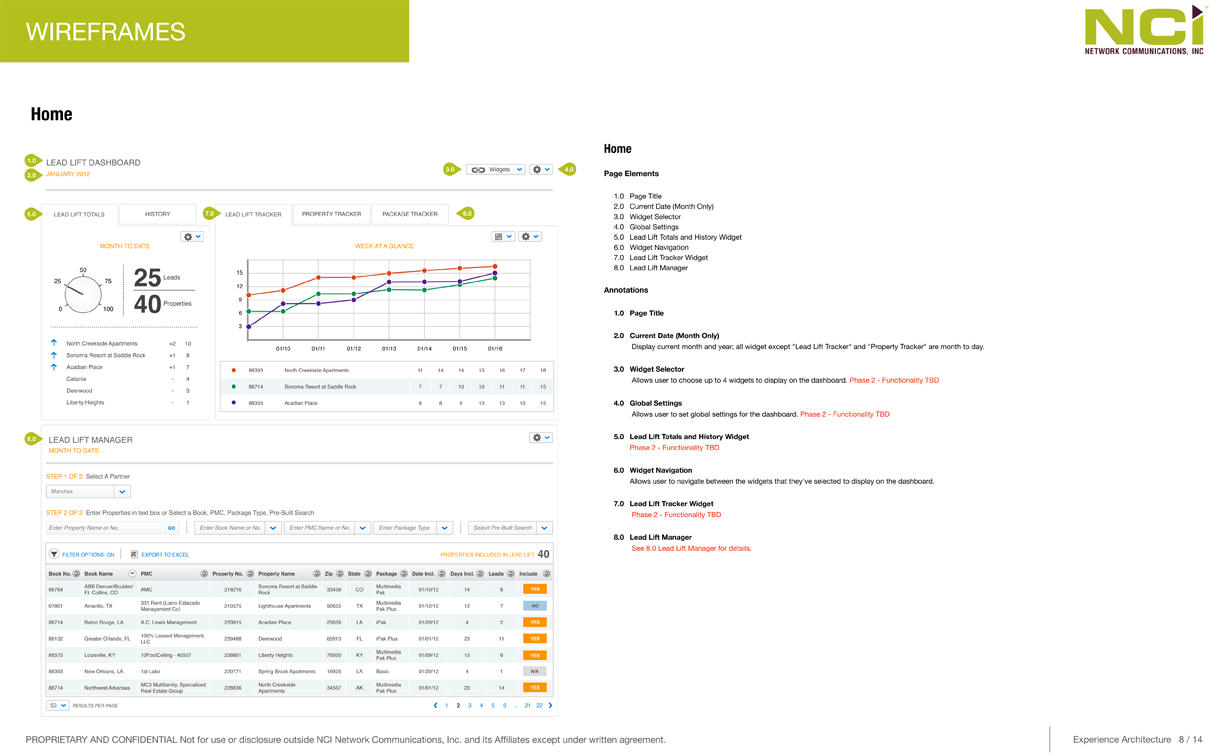
The home dashboard answered "how am I doing?" immediately, lead volume, conversion rate, and cost-per-lease surfaced without any navigation required.
Search, filter, and compare
Source-level ROI comparison
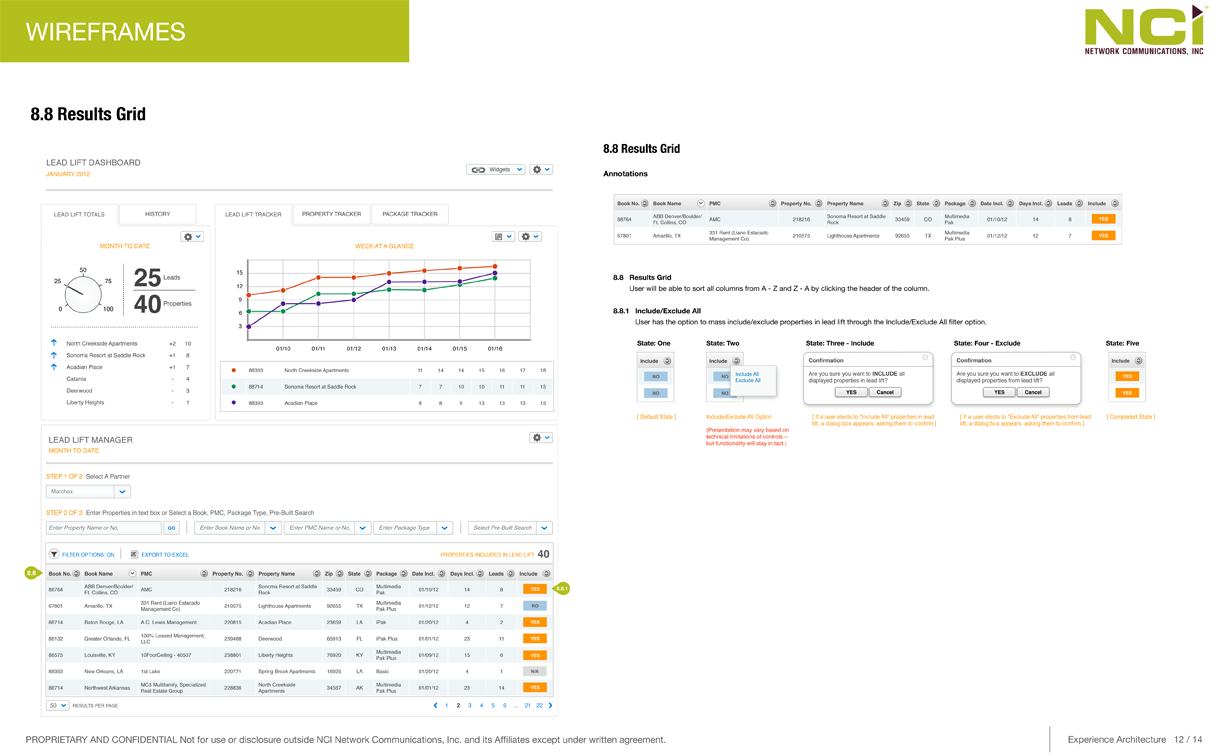
Results grid, sortable, scannable lead performance organized in decision order: source, leads generated, prospects, tours, signed leases, and cost per lease.
The workflow made analytics more usable because it followed the decision sequence. Users could start with portfolio performance, narrow to source-level ROI, compare advertising investments, and arrive at the evidence they needed for renewal conversations.
The most important design decision was to organize the product around the business question, not the data model.
The available data was broad, but the user's question was focused: "Which advertising investments are working?" Once that became the center of the design, the product direction became clearer. The interface needed to help users move from summary to source-level ROI without making them assemble the analysis manually.
This project reinforced a principle I still use in enterprise analytics work: dashboards are only useful when they help people make a decision. The goal is not to show everything. The goal is to surface the right evidence at the right level of detail.
How I designed a decision-sequenced workflow for suppliers disputing financial chargebacks before a 90-day deadline.
What This Shaped
Lead Lift gave property managers and regional directors a shared view of advertising performance: which sources were generating leads, which were converting, and what each lease actually cost. That visibility changed how performance reviews happened — from tracking activity to evaluating ROI by source.
For Apartment Finder, advertiser retention depended on demonstrating that listing spend produced measurable results. A property manager who could see cost per lease by source had a concrete reason to renew. That was the business case Lead Lift was designed to support.